


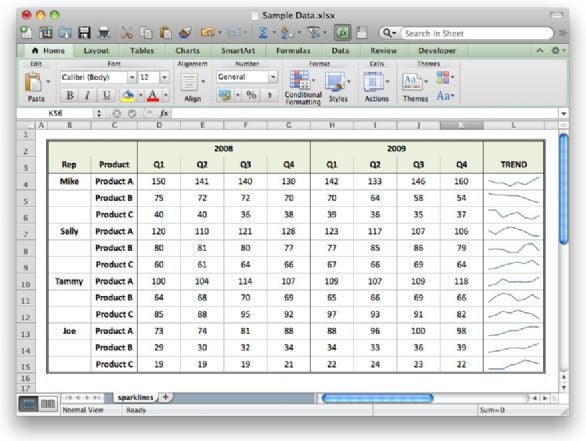
I follow MacWorld hints and the other day a tips and tricks was released for Excel 2011. They posted 3 tips, one of which I think would really be useful for Superintendents. The use of Sparklines. Sparklines gives you the ability to insert a small line graph into a cell which will show the trends. This would be great to use in budgets to show how certain expense lines or labor trend during the year. This could also be used to show irrigation usage, fert trends, the list can go on. From my experience, being able to show something visually like this really helps to get a point across. Below is a picture of a Sparkline example as well as the article from MacWorld.
Three great tips for Excel 2011 for Mac
0 comments:
Post a Comment